Dashboard Overview
Home → Dashboard is the first page after you log in. From top to bottom it shows:
Setup progress
Until Setup is finished, a card at the top shows Setup with how many steps are done (for example Setup 3/5), the next step, and Continue setup. Once every step is done it shrinks to a line, Ready to sell, with a Review setup link. See Getting Started.
A new store (one with no products yet, or less than a week old) also gets a welcome window the first time, with the same checklist. Got it, let's go! closes it for good.
Revenue
| Card | What it shows |
|---|---|
| Month to Date | This month's revenue, with the year to date (YTD) under it |
| Projected Monthly | Where the month ends up if the daily average so far holds |
Both are gross figures (including tax and shipping).
Open Order Value is a bar under the cards, shown when there are open orders: the total of orders that are processing, partially shipped or shipped.
Which orders count. Settings → General → Dashboard Settings → Revenue Display Mode chooses between All Paid Orders (processing, shipped and completed) and Shipped Orders Only (completed orders only). It changes Month to Date, YTD and Projected Monthly.
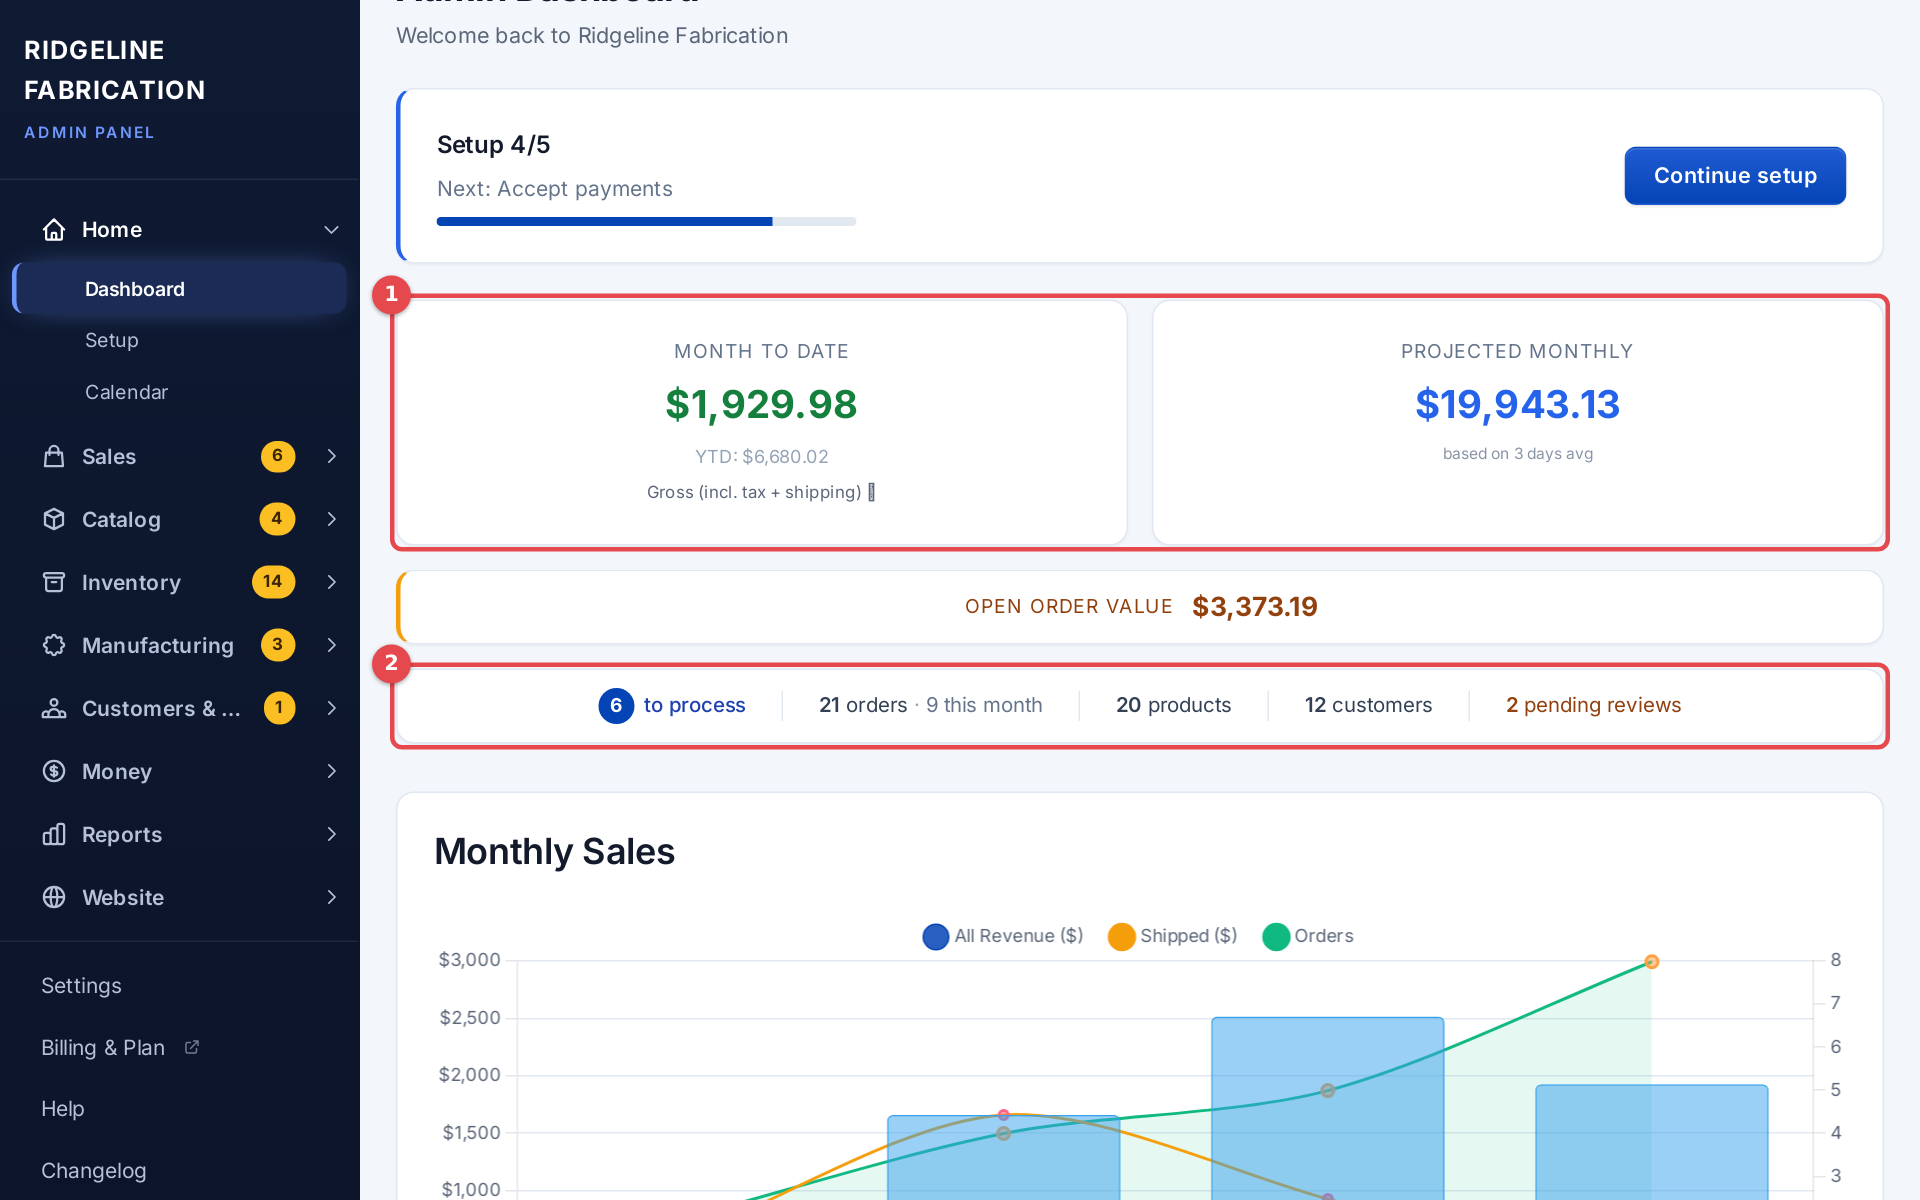 The revenue cards and the quick stats strip
Quick stats
A strip of links under the revenue cards. Each one opens the matching list:
- to process: paid orders waiting to be fulfilled (shown when there are any). Opens Orders filtered to Processing.
- orders: all orders except cancelled ones, with how many came in this month.
- products: everything in your catalog.
- customers: how many different customers have placed an order.
- pending reviews: reviews waiting for approval (shown when there are any).
Build queue
If you sell build-to-order products with a build queue limit, the strip also shows Build Queue: one small bar for each product that has builds in its queue, plus Global when you set a store-wide limit (Settings → General → Global Build Queue Capacity (Optional)). Each shows how many slots are left (avail). The bar turns amber at 75% full and red when full. Hover over Build Queue for an explanation. Set a product's limit on its Inventory tab under Build Queue Capacity (Optional); see Products.
Monthly Sales
A chart of the last 12 months: revenue bars for all paid orders, a line for shipped (completed) orders, and the number of orders.
Goal Tracker
Track this month's sales against a target:
- Click Set Goals.
- Enter Goal 1 (Primary) and, if you like, Goal 2 (Stretch), then click Save Goals.
- The chart builds up your sales day by day through the month, with each goal as a line to beat.
- Goal 1 Progress and Goal 2 Progress show how far along you are, as a percentage.
Recent Orders and Top Products
At the bottom: the 10 most recent orders (not counting cancelled ones) with their customer, total, status and date, and your 10 best-selling products.